

Introduction: Why Your Business Can’t Afford to Ignore Performance Reporting
Companies that are winning in today’s fast-paced business environment know that guesswork doesn’t cut. If you’re not leveraging performance reporting, you’re operating blind—and that’s a dangerous way to grow any business. Never mind scaling!
Performance reporting is more than just a digital transformation buzzword or a task for your analytics team. It’s the engine that:
– drives smarter decisions,
– boosts team productivity, and
– maximises profitability.
Yet, many small to medium-sized businesses (SMBs) struggle to get it right. Instead of clear direction, they drown in data, unsure of which metrics actually matter.
But here’s the kicker: it’s not about having more reports—it’s about having the right reports.
The Cost of Flying Blind
Businesses that ignore or misuse performance reporting risk falling behind their competitors.
According to a recent study by Deloitte;
• 49% of high-performing companies attribute their success to data-driven decision-making.
• Conversely, 70% of businesses fail to achieve their goals because of poorly aligned strategies, often stemming from insufficient data insights.
If you’re not tracking your Key Performance Indicators (KPIs) or analyzing critical metrics, how can you ensure you’re making the right moves to grow your business?
• Are your marketing campaigns generating enough of the right leads?
• Is your team meeting performance benchmarks?
• Are your operations optimized for cost and efficiency?
Without answers to these questions, you’re guessing—and guesses don’t build profitable, scalable businesses.
The Typical Marketing Misstep
You run a marketing campaign you’re convinced will be a game-changer. You include all the bells and whistles—great visuals, compelling copy, and targeted distribution. You pour significant resources into the campaign; confident it will deliver.
But you skip one critical step: tracking and analyzing the campaign’s performance.
The result? A massive budget overrun and little to show for it.
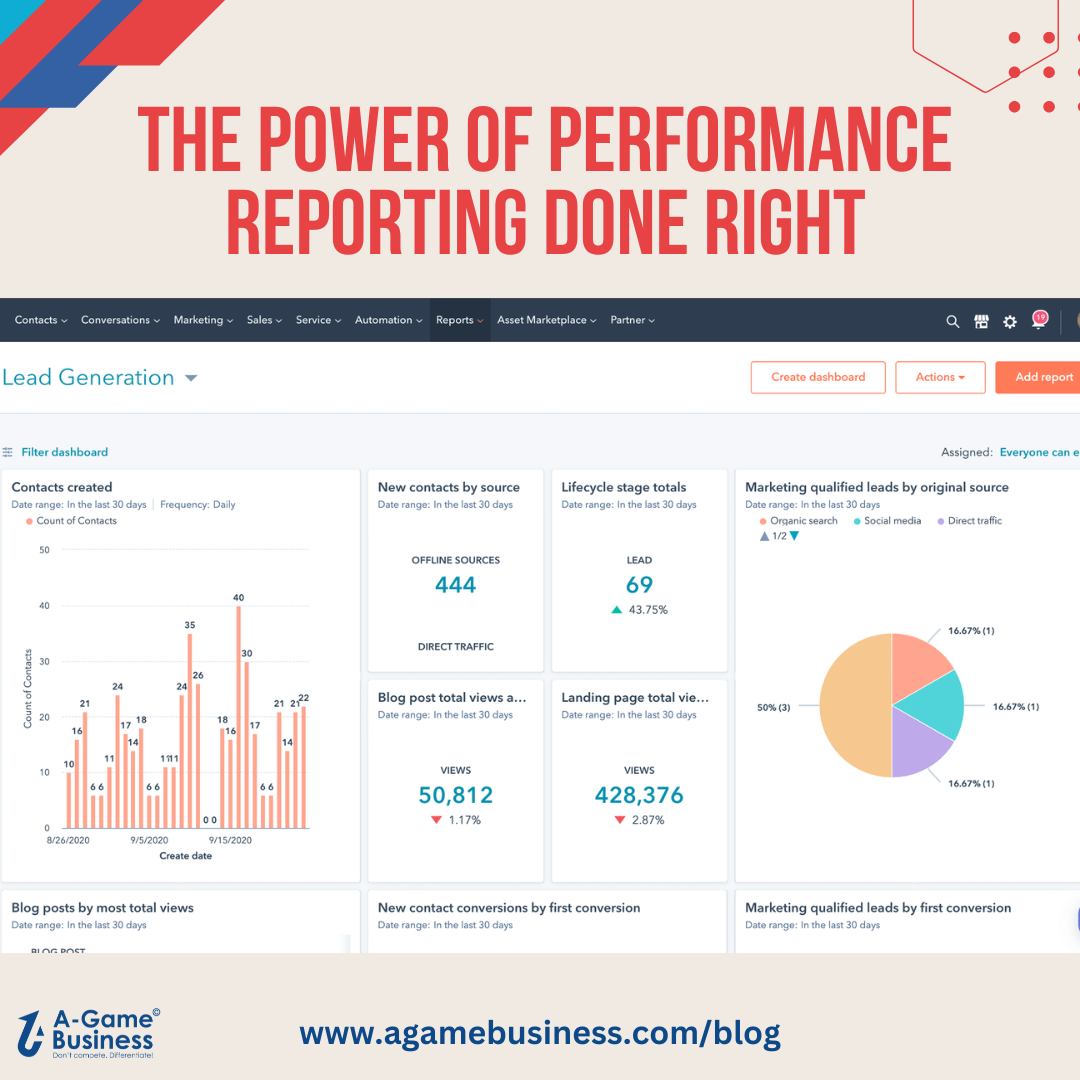
What is Performance Reporting and Why Does It Matter?
The Lifeblood of Business Success
Performance reports track your business’s progress toward its goals using data. It’s not just a tool – it’s your competitive edge in today’s data-driven world.
Here’s why it matters:
• Informed Decisions: With clear data, you can identify opportunities, spot inefficiencies, and course-correct before small issues become big problems.
• Focus on What Counts: Performance reports cut through the noise, showing you which actions drive results and which are wasted efforts.
• Accountability: Performance Reporting keeps all departments working together toward the same company’s goals.
The Proof is in the Numbers
McKinsey says using performance metrics boosts profits by 20-30%. Data doesn’t just enhance your strategy; it validates it.
What Happens Without Performance Reporting?
Without performance reporting, businesses fall into these traps:
1. Missed Opportunities: You might overlook promising trends or markets because you’re not tracking the right data.
2. Inefficient Operations: Wasted time and money on strategies that don’t work.
3. Lack of Direction: Teams operate in silos, working hard but achieving little.
Imagine driving a car with a fogged-up windshield. That’s what running a business without performance reports feels like—dangerous and destined for detours.
A Quick Snapshot of What to Measure
Performance reporting isn’t about tracking everything. It’s about focusing on key performance indicators (KPIs) that align with your goals:
• Sales Metrics: Revenue growth, conversion rates, and deal closure timelines.
• Marketing Analytics: Website traffic, lead quality, and campaign ROI.
• Operational Insights: Productivity levels, cost efficiency, and team performance.
The beauty of performance reporting? It transforms raw data into useful knowledge, giving your people the clarity they need every day.
Let’s break down the tools that make this possible in the next section.
How to Create and Use Performance Reports Effectively
Start with Clear Goals
Performance reports are only as good as the goals they support. Define what success looks like for your business. Are you aiming to grow revenue, improve customer retention, or boost team productivity?
Each goal requires tracking specific key performance indicators (KPIs). For example:
• If revenue growth is the target, focus on sales performance metrics like conversion rates and average deal size.
• For customer retention, measure churn rates and satisfaction scores.
• To improve team efficiency, track task completion rates and project timelines.
Choose the Right Tools
Using the right tools simplifies reporting and ensures accuracy. Start with cost-effective options like:
• WordPress Google Site Kit for website analytics.
• HubSpot Free for CRM and tracking sales pipelines.
• Google Workspace and Microsoft Office provide a wealth operations and people data analysis. Systems like Microsoft Dynamics 365, Salesforce, and SAP offer pre-built reports for advanced operational and reporting needs. These tools integrate multiple data sources, saving time and offering a single source of truth.
Limit Your Focus to Key Reports
Overloading on reports leads to confusion. Stick to 3-5 critical reports tailored to your business needs.
Examples include:
• Sales Performance Report: Tracks revenue growth, sales cycle length, and close rates.
• Marketing Analytics Report: Measures website traffic, lead quality, and ad campaign ROI.
• Financial Summary Report: Highlights profit margins, expenses, and cash flow trends. Using over 7 reports creates diminishing returns and dilutes focus.
Customize for Clarity
Reports should be clear, concise, and actionable. Use visual tools like charts and graphs to simplify complex data. Ensure your reports highlight trends and outliers rather than overwhelming users with raw data. Tailor the format to your audience—executives might need high-level summaries, while team leads require granular details.
Schedule Regular Reviews
Consistency is critical. Set a review cadence that aligns with your reporting needs:
• Daily: For operational metrics like sales activities and website traffic.
• Weekly: For marketing and project updates.
• Monthly: For financial and strategic performance. Regular reviews ensure you catch trends early, act on insights, and stay on course toward your goals.
Turn Insights Into Action
Data is useless if it doesn’t drive decisions. For example, if a report shows a specific sales channel underperforming, use that insight to reallocate resources or adjust your strategy. Treat your performance reports as dynamic tools that evolves with your business, not static documents that gather dust.
With these steps, you’ll transform performance reporting into a powerful tool for growth. Next, we’ll uncover common mistakes to avoid and how to sidestep them.
Common Mistakes and How to Avoid Them
Mistake 1: Tracking Too Many Metrics
One of the biggest pitfalls in performance reporting is tracking everything. Not all data is valuable, and chasing too many metrics leads to analysis paralysis. Instead of actionable insights, you end up overwhelmed by noise.
How to Avoid It:
Focus on 3-5 key performance indicators (KPIs) that align with your business objectives. For example:
– If your goal is revenue growth, prioritize metrics like sales conversion rates and average deal size.
– For operational efficiency, monitor task completion rates and time-to-delivery.
Remember, less is more when the data is meaningful.
Mistake 2: Ignoring Context
Numbers alone don’t tell the full story. Falling sales can be worrying, but don’t jump to conclusions without checking things like the season or market changes.
How to Avoid It:
Always analyze performance metrics in context. Supplement quantitative data with qualitative insights, such as customer feedback or industry trends. Tools like HubSpot Free and Google Workspace let you integrate notes and external data for a more holistic view.
Mistake 3: Failing to Act on Insights
Data without action is wasted effort. A report might highlight that one marketing campaign is outperforming others. But if you don’t allocate more budget to it, the insight is meaningless.
How to Avoid It:
Build a system where reports lead to decisions. For example:
– Schedule monthly strategy meetings to discuss key findings.
– Assign action items based on the data.
– Use project management tools like ClickUp or Monday.com to track progress on decisions made from reports.
Mistake 4: Overloading Teams with Reports
Bombarding your team with reports can create confusion and dilute focus. If team members are juggling dozens of metrics, they’ll struggle to prioritize their efforts.
How to Avoid It:
Curate reports based on roles. For instance:
– Sales teams need metrics on deals closed and pipeline health.
– Marketing teams should see campaign ROI and lead quality reports.
– Executives require high-level summaries of revenue, expenses, and growth rates.
A unified system like SalesForce or Microsoft Dynamics 365 can help you customize dashboards and streamline reporting for each team.
Mistake 5: Using Outdated Tools or Methods
Manual reporting with spreadsheets may have worked in the past. But today’s fast-paced business environment demands automation and real-time updates.
How to Avoid It:
Upgrade to tools that fit your business scale and needs. Start small with free options like WordPress Google Site Kit and scale to premium solutions like SAP or Microsoft Dynamics 365 as your business grows. Automating your reports saves time and reduces errors, ensuring you always have up-to-date insights.
Best Practices for Seamless Performance Reporting
Start with Unified Systems
A unified system simplifies reporting by consolidating data from multiple sources. One system will replace many. Instead of juggling spreadsheets and standalone tools, you’ll have a single platform providing a comprehensive view of your business.
Recommended Tools:
- For Beginners: Free or entry-level solutions like HubSpot Free or Google Workspace.
- For Growing Businesses: Mid-tier systems like ClickUp, Monday.com, or premium versions of CRMs.
- For Scalability: Enterprise-level solutions like Microsoft Dynamics 365, SalesForce, or SAP. These tools come with predefined critical reports that save time and offer deep insights.
With a unified system, you eliminate redundancies and minimize errors, allowing your team to focus on what matters most—executing data-backed strategies.
Focus on Visual Simplicity
Data is only useful if it’s easy to understand. Clunky, text-heavy reports overwhelm the reader and often get ignored.
How to Implement:
– Use graphs, charts, and heatmaps to visualize trends and outliers.
– Highlight key findings with bullet points or summary boxes.
– Keep the design clean and intuitive—focus on clarity over complexity.
Visualizing data helps teams grasp insights faster, making reports actionable rather than intimidating.
Set a Reporting Cadence
The timing of your reports is as important as their content. Reviewing metrics too frequently can waste time, while infrequent reviews may leave critical trends unnoticed.
Best Practices by Report Type:
- Daily: Sales activity, website traffic, and operational updates.
- Weekly: Marketing performance, customer support metrics, and project timelines.
- Monthly: Financial summaries, team performance reviews, and long-term strategy tracking.
A consistent schedule ensures everyone remains aligned and that insights drive timely decisions.
Encourage Collaboration
Reporting shouldn’t live in a silo. Involve your team to create a culture of data-driven decision-making. Collaborative tools like Microsoft Teams or ClickUp can make it easier to share reports, assign tasks, and track actions based on data insights.
Pro Tip:
Host monthly cross-departmental meetings where teams can share their findings and discuss actionable steps. This ensures alignment and accountability across the organization.
Train Your Team on Tools and Insights
Even the best tools are useless if your team doesn’t know how to use them. Invest time in training employees to interpret reports and use reporting software effectively.
How to Get Started:
– Schedule onboarding sessions for new tools like SalesForce or HubSpot.
– Provide guidelines on interpreting key metrics relevant to each role.
– Encourage team members to ask questions and seek clarity.
A well-trained team will not only use reports but also contribute to improving the reporting process itself.
The Future of Performance Reporting
Automation Takes the Lead
The increasing automation of data collection and analysis is making manual reporting processes outdated and inefficient. With advancements in automation, tools can now compile data, generate reports, and even suggest actions based on trends—all in real time.
Systems like Microsoft Dynamics 365 and SalesForce are leading the charge by offering automated dashboards that update as new data flows in. This not only saves time but also reduces the risk of human error, ensuring more accurate insights.
AI and Predictive Analytics
Artificial Intelligence (AI) is transforming performance reporting by offering predictive capabilities. Instead of just analyzing past data, AI-powered tools can forecast trends, identify risks, and recommend actions.
For example:
– Predictive models can estimate sales revenue based on pipeline activity.
– AI can analyze customer behavior to suggest improvements in marketing campaigns. Tools like SAP’s AI-enhanced analytics are making predictive reporting accessible to businesses of all sizes.
Personalized Dashboards
The future of reporting lies in personalization. With customizable dashboards, team members can view the metrics most relevant to their roles. A sales rep might prioritize lead conversion rates, while a marketing manager focuses on campaign ROI. Unified systems like Monday.com and ClickUp already offer this feature, and as technology evolves, customization will become even more intuitive.
Real-Time Insights
Gone are the days of static, outdated reports. Businesses are shifting toward real-time insights that allow them to act instantly.
For example:
– A marketing team can adjust ad spend mid-campaign based on real-time ROI metrics.
– Operations managers can identify and resolve bottlenecks as they happen. With tools like HubSpot Free or Google Site Kit, even SMBs can access real-time data without breaking the bank.
Mobile Accessibility
Performance reporting is no longer confined to desktops. Mobile-friendly tools ensure that decision-makers can access critical reports from anywhere. Apps like Microsoft Teams, SalesForce, and Google Workspace are optimizing their platforms for seamless mobile experiences. This flexibility empowers leaders to make informed decisions on the go.
Ethical Data Usage
As data collection becomes more advanced, ethical considerations take centre stage. Businesses must prioritize transparency, ensure data privacy, and comply with regulations like POPI Act and GDPR. Ensure your tools have built-in compliance checks to help navigate these challenges responsibly.
Conclusion
Performance reporting is no longer a nice-to-have; it’s an essential driver of business success. When done right, it empowers you to make informed decisions, align teams, and scale with confidence. The key is to focus on quality over quantity, leveraging the right tools and strategies to track meaningful metrics that align with your goals.
Whether you’re just starting with free tools like HubSpot Free and Google Workspace or scaling with advanced systems like Microsoft Dynamics 365, the principles remain the same: keep it simple, actionable, and aligned with your business objectives.
Avoid common mistakes, adopt best practices, and embrace performance reporting, and you’ll transform data into a powerful growth engine. The time to start is now. Define your goals, choose your tools, and let your reports guide your journey to success.
Ready to optimize your performance reporting?
Start small focus on 3-5 critical metrics and explore free tools like Google Site Kit or HubSpot Free to kickstart your journey.
Let data lead the way to smarter decisions and a more profitable business in 2025. Complete the form below for a free consultation.

Data is only as good as the insights we can extract from it! We need to be focus on the RIGHT data to make informed decisions that'll drive meaningful growth.