

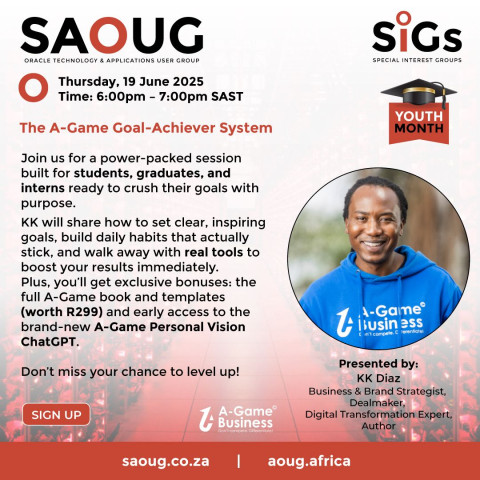
🎓Calling all Students, Graduates and Interns - join this ‘free’ Youth Month webinar on 19 June led by our CEO @KK Diaz 🎓
✨The A-Game Goal-Achiever System✨
Register to attend and learn a system that helps you:
💫Set a clear and inspiring personal vision and goals,
💫Align daily habits with long-term vision for consistency towards achieving it, with
💫Real tools you can use immediately to improve goal-execution.
🌟BONUS 1: Get the book and accompanying templates to start using this proven system (worth R299)
🌟BONUS 2: Test out the new A-Game Personal Vision Custom ChatGPT
⭕Sign up and bring your A-Game... by the end of the session, you’ll walk away with your own Goal-Achiever System—no fluff, just a proven system.
Register here: saoug.co.za/the-a-game-goal-achiever-system
@Mthiya Lunga , great post. We're starting a youth development project in Glen Ridge #Soweto now in June 2025. We would love to see the business concepts and if we could integrate them into the programme. Let's connect 🙏🏾
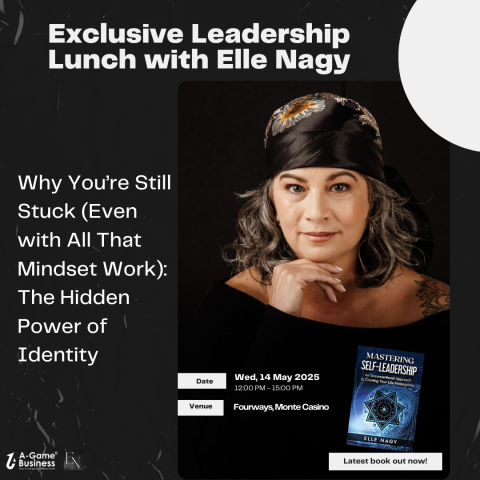
Why You're Still Stuck.
📌 You’ve read the books.
📌 You’ve done the mindset work.
So why does lasting change still feel out of reach?
Join New Zealand-based transformational #coach and author Elle Nagy, live in Fourways South Africa, for an intimate 1-time only self-leadership learning lunch.
In this rare, soul-stirring conversation, Elle will guide us beyond mindset and into the core of identity—the often-overlooked inner architecture shaping our choices, actions, and results.
What To Expect:
✅ A grounded yet transformative lunch experience.
✅ Deep, thought-provoking dialogue—not surface-level motivation.
✅ A safe space to reflect, connect, and ask bold questions.
✅ Insights that bridge personal development and professional growth.
This is not another motivational talk. It’s a conversation that could shift how you see yourself—and how you lead.
Space is limited. Reserve your seat and be part of a gathering that nourishes both body and soul.
DATE: Wednesday, 14 May 2025, 12h00 pm – 15h00 pm
VENUE: Fourways, Monte Casino
PARTICIPATION FEE: R99, Excludes lunch.
Click this link to reserve your spot: agamebusiness.com/ellenagy/
#selfleadership #mindsetchange #transformationalcoach #event
A Balanced Scorecard is like giving your business a strategic health check-up.📈 #StrategicThinking #Leadership
🚀 The breakdown of strategic execution into stages is pure gold. Thanks for sharing this valuable knowledge!
This podcast sounds like a masterclass in unlocking Africa's educational potential and how we can all play a part in shaping a brighter future. #EducationMatters
#USA President Trump expels South African Ambassador EbrahimRasool
According to US Secretary of State Marco Rubio, Rasool is a "race-baiting politician" who "hates Trump and America", and as a result is not welcome in the US.
What are your thoughts on this latest move in the #SAvsUS saga?
How do you see this affecting relations at a national level, business-to-business as well as at citizen-to-citizen?
Comment below 👇🏾
Talking about #strategy, make sure to register for our upcoming webinar: https://agamebusiness.com/strategy-webinar/
⏳ Budget 2025: Missed Opportunity 🇿🇦
The last-minute delay of #SouthAfrica ’s 2025 #budgetspeech has shaken market confidence, with the rand slipping about 1%.
This isn’t just about market movements—it’s a signal of growing uncertainty.
Now more than ever, businesses need to focus on resilience, adaptability, and strategic planning to thrive despite the turbulence.
💡 How are you adapting your strategy amid this uncertainty?

-
·
·Great Ad, well done 👏🏾👏🏾👏🏾